


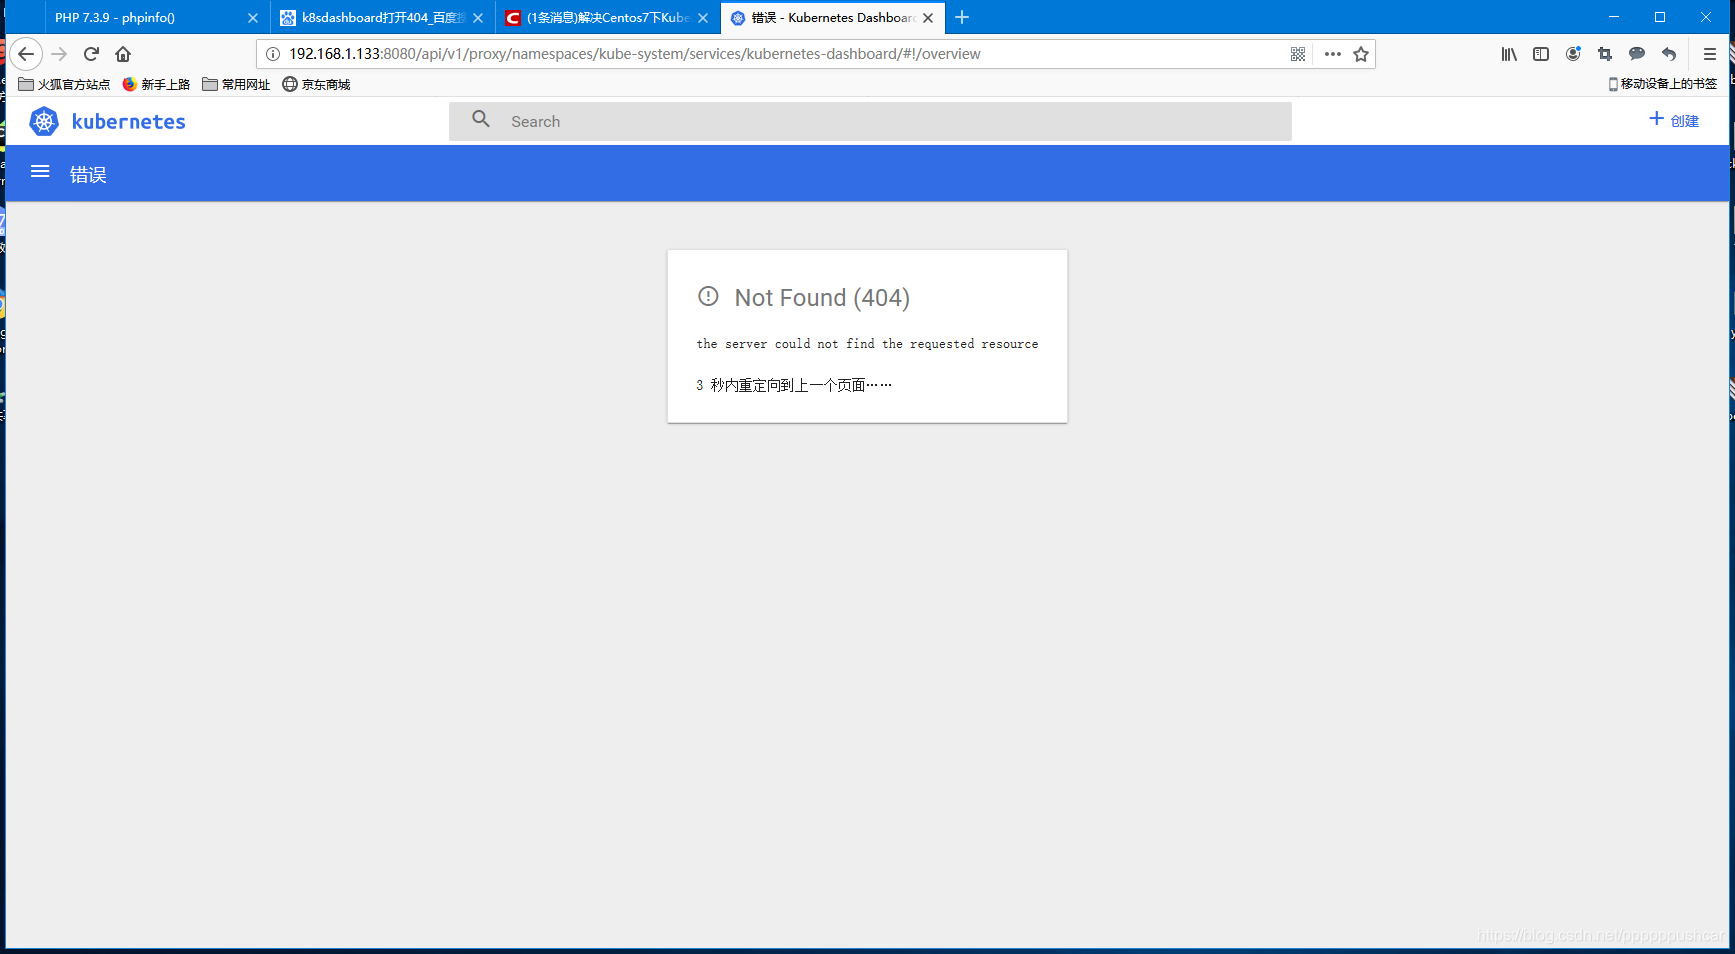
搭建K8S 的dashboard的时候显示404
the server could not find the requested resource
如图所示
然后日志文件 是这个样子的
Oct 17 03:40:04 k8s-node2 journal: 2019/10/17 07:40:04 No metric client provided. Skipping metrics.
Oct 17 03:40:04 k8s-node2 journal: 2019/10/17 07:40:04 Getting pod metrics
Oct 17 03:40:04 k8s-node2 journal: 2019/10/17 07:40:04 No metric client provided. Skipping metrics.
Oct 17 03:40:04 k8s-node2 journal: 2019/10/17 07:40:04 No metric client provided. Skipping metrics.
Oct 17 03:40:04 k8s-node2 journal: 2019/10/17 07:40:04 No metric client provided. Skipping metrics.
Oct 17 03:40:08 k8s-node2 journal: 2019/10/17 07:40:08 [2019-10-17T07:40:08Z] Incoming HTTP/1.1 GET /api/v1/login/status request from 172.16.88.0:33056: {}
Oct 17 03:40:08 k8s-node2 journal: 2019/10/17 07:40:08 [2019-10-17T07:40:08Z] Outcoming response to 172.16.88.0:33056 with 200 status code
Oct 17 03:40:08 k8s-node2 journal: 2019/10/17 07:40:08 [2019-10-17T07:40:08Z] Incoming HTTP/1.1 GET /api/v1/overview?filterBy=&itemsPerPage=10&name=&page=1&sortBy=d%!C(MISSING)creationTimestamp request from 172.16.88.0:33056: {}
Oct 17 03:40:08 k8s-node2 journal: 2019/10/17 07:40:08 Getting config category
Oct 17 03:40:08 k8s-node2 journal: 2019/10/17 07:40:08 Getting discovery and load balancing category
Oct 17 03:40:08 k8s-node2 journal: 2019/10/17 07:40:08 Getting lists of all workloads
Oct 17 03:40:08 k8s-node2 journal: 2019/10/17 07:40:08 the server could not find the requested resource
Oct 17 03:40:08 k8s-node2 journal: 2019/10/17 07:40:08 [2019-10-17T07:40:08Z] Outcoming response to 172.16.88.0:33056 with 404 status code
Oct 17 03:40:08 k8s-node2 journal: 2019/10/17 07:40:08 No metric client provided. Skipping metrics.
Oct 17 03:40:08 k8s-node2 journal: 2019/10/17 07:40:08 No metric client provided. Skipping metrics.
Oct 17 03:40:08 k8s-node2 journal: 2019/10/17 07:40:08 No metric client provided. Skipping metrics.
Oct 17 03:40:08 k8s-node2 journal: 2019/10/17 07:40:08 Getting pod metrics
Oct 17 03:40:08 k8s-node2 journal: 2019/10/17 07:40:08 No metric client provided. Skipping metrics.
Oct 17 03:40:12 k8s-node2 journal: 2019/10/17 07:40:12 [2019-10-17T07:40:12Z] Incoming HTTP/1.1 GET /api/v1/login/status request from 172.16.88.0:33056: {}
Oct 17 03:40:12 k8s-node2 journal: 2019/10/17 07:40:12 [2019-10-17T07:40:12Z] Outcoming response to 172.16.88.0:33056 with 200 status code
Oct 17 03:40:12 k8s-node2 journal: 2019/10/17 07:40:12 [2019-10-17T07:40:12Z] Incoming HTTP/1.1 GET /api/v1/overview?filterBy=&itemsPerPage=10&name=&page=1&sortBy=d%!C(MISSING)creationTimestamp request from 172.16.88.0:33056: {}
Oct 17 03:40:12 k8s-node2 journal: 2019/10/17 07:40:12 Getting config category
Oct 17 03:40:12 k8s-node2 journal: 2019/10/17 07:40:12 Getting discovery and load balancing category
Oct 17 03:40:12 k8s-node2 journal: 2019/10/17 07:40:12 Getting lists of all workloads
Oct 17 03:40:12 k8s-node2 journal: 2019/10/17 07:40:12 the server could not find the requested resource
Oct 17 03:40:12 k8s-node2 journal: 2019/10/17 07:40:12 [2019-10-17T07:40:12Z] Outcoming response to 172.16.88.0:33056 with 404 status code
Oct 17 03:40:12 k8s-node2 journal: 2019/10/17 07:40:12 No metric client provided. Skipping metrics.
Oct 17 03:40:12 k8s-node2 journal: 2019/10/17 07:40:12 No metric client provided. Skipping metrics.
Oct 17 03:40:12 k8s-node2 journal: 2019/10/17 07:40:12 Getting pod metrics
Oct 17 03:40:12 k8s-node2 journal: 2019/10/17 07:40:12 No metric client provided. Skipping metrics.
Oct 17 03:40:12 k8s-node2 journal: 2019/10/17 07:40:12 No metric client provided. Skipping metrics.
Oct 17 03:40:16 k8s-node2 journal: 2019/10/17 07:40:16 [2019-10-17T07:40:16Z] Incoming HTTP/1.1 GET /api/v1/login/status request from 172.16.88.0:33056: {}
Oct 17 03:40:16 k8s-node2 journal: 2019/10/17 07:40:16 [2019-10-17T07:40:16Z] Outcoming response to 172.16.88.0:33056 with 200 status code
Oct 17 03:40:16 k8s-node2 journal: 2019/10/17 07:40:16 [2019-10-17T07:40:16Z] Incoming HTTP/1.1 GET /api/v1/overview?filterBy=&itemsPerPage=10&name=&page=1&sortBy=d%!C(MISSING)creationTimestamp request from 172.16.88.0:33056: {}
Oct 17 03:40:16 k8s-node2 journal: 2019/10/17 07:40:16 Getting config category
Oct 17 03:40:16 k8s-node2 journal: 2019/10/17 07:40:16 Getting discovery and load balancing category
Oct 17 03:40:16 k8s-node2 journal: 2019/10/17 07:40:16 Getting lists of all workloads
Oct 17 03:40:16 k8s-node2 journal: 2019/10/17 07:40:16 the server could not find the requested resource
Oct 17 03:40:16 k8s-node2 journal: 2019/10/17 07:40:16 [2019-10-17T07:40:16Z] Outcoming response to 172.16.88.0:33056 with 404 status code
Oct 17 03:40:16 k8s-node2 journal: 2019/10/17 07:40:16 No metric client provided. Skipping metrics.
Oct 17 03:40:16 k8s-node2 journal: 2019/10/17 07:40:16 No metric client provided. Skipping metrics.
Oct 17 03:40:16 k8s-node2 journal: 2019/10/17 07:40:16 No metric client provided. Skipping metrics.
Oct 17 03:40:16 k8s-node2 journal: 2019/10/17 07:40:16 Getting pod metrics
Oct 17 03:40:16 k8s-node2 journal: 2019/10/17 07:40:16 No metric client provided. Skipping metrics.
Oct 17 03:40:20 k8s-node2 journal: 2019/10/17 07:40:20 [2019-10-17T07:40:20Z] Incoming HTTP/1.1 GET /api/v1/login/status request from 172.16.88.0:33056: {}
Oct 17 03:40:20 k8s-node2 journal: 2019/10/17 07:40:20 [2019-10-17T07:40:20Z] Outcoming response to 172.16.88.0:33056 with 200 status code
Oct 17 03:40:20 k8s-node2 journal: 2019/10/17 07:40:20 [2019-10-17T07:40:20Z] Incoming HTTP/1.1 GET /api/v1/overview?filterBy=&itemsPerPage=10&name=&page=1&sortBy=d%!C(MISSING)creationTimestamp request from 172.16.88.0:33056: {}
Oct 17 03:40:20 k8s-node2 journal: 2019/10/17 07:40:20 Getting config category
Oct 17 03:40:20 k8s-node2 journal: 2019/10/17 07:40:20 Getting discovery and load balancing category
Oct 17 03:40:20 k8s-node2 journal: 2019/10/17 07:40:20 Getting lists of all workloads
Oct 17 03:40:20 k8s-node2 journal: 2019/10/17 07:40:20 the server could not find the requested resource
Oct 17 03:40:20 k8s-node2 journal: 2019/10/17 07:40:20 [2019-10-17T07:40:20Z] Outcoming response to 172.16.88.0:33056 with 404 status code
Oct 17 03:40:20 k8s-node2 journal: 2019/10/17 07:40:20 No metric client provided. Skipping metrics.
Oct 17 03:40:20 k8s-node2 journal: 2019/10/17 07:40:20 No metric client provided. Skipping metrics.
Oct 17 03:40:20 k8s-node2 journal: 2019/10/17 07:40:20 No metric client provided. Skipping metrics.
Oct 17 03:40:20 k8s-node2 journal: 2019/10/17 07:40:20 Getting pod metrics
Oct 17 03:40:20 k8s-node2 journal: 2019/10/17 07:40:20 No metric client provided. Skipping metrics.
求大神告诉我怎么解决的
docker.service 我配置了
iptables 我配置了
节点上的 对应容器也起来了
(已解决)
在官网上下载beta 版本的就可以了!!!!!!!!!


 669
669


 被折叠的 条评论
为什么被折叠?
被折叠的 条评论
为什么被折叠?
 到【灌水乐园】发言


